


Why OpenTelemetry is awesome

Introduction
This post is about how we used OpenTelemetry in our Python backend server to troubleshoot slow API response times and why OpenTelemetry is awesome and why you should use it too.
What is OpenTelemetry Tracing?
OpenTelemetry tracing is part of the larger OpenTelemetry project, which aims to provide a unified, vendor-neutral framework for collecting telemetry data – metrics, logs, and traces – from applications and infrastructure.
At its core, tracing in OpenTelemetry is about following a request as it flows through your system. Think of it as leaving breadcrumbs along the path of execution. Each "breadcrumb" is a span, representing a unit of work or operation. These spans are connected to form a trace, which shows the entire journey of a request from start to finish.
OpenTelemetry tracing goes beyond traditional logging or metrics collection. It provides a holistic view of your application's behavior, showing not just what happened, but how and where it happened across your entire system, regardless if you have a monolith or micro-service architecture.
Why OpenTelemetry Tracing is Awesome
Easy to integrate into your application
For example in case of Python you could create an decorator for tracing like shown here:
# utils/tracing.py

from functools import wraps
from opentelemetry import trace

tracer = trace.get_tracer(__name__)

def traced(name: str = None):
    def decorator(func):
        @wraps(func)
        async def wrapper(*args, **kwargs):
            span_name = name or func.__name__
            current_span = trace.get_current_span()

            # If there's an active span, create a child span
            if current_span.is_recording():
                with tracer.start_as_current_span(span_name) as span:
                    return await _handle_span(func, span, *args, **kwargs)
            else:
                # If there's no active span, create a new one
                with tracer.start_as_current_span(span_name) as span:
                    return await _handle_span(func, span, *args, **kwargs)

        return wrapper

    return decorator


async def _handle_span(func, span, *args, **kwargs):
    request = next((arg for arg in args if isinstance(arg, (Request, StarletteRequest))), None)
    if request:
        span.set_attribute("http.method", request.method)
        span.set_attribute("http.url", str(request.url))

    result = await func(*args, **kwargs)
    return result
# app/main.py from app.core.tracing import traced @traced("process_user_request") async def dummy_function(x: str, y: str): result = x + y return resultAllows creating an unified view of application observability by including metrics, logs and traces into one offering. Traces are mapped to the log entries, so in case of issues - you can see the log and trace together
Vendor neutral - you can use OpenTelemetry with Grafana, DataDog or any other provider
Great way how to troubleshoot performance bottlenecks and other issues in a live system
Finding Performance Bottlenecks using OpenTelemetry and Grafana Cloud
At Polyglot Pal, we have chat API endpoints that are responsible for handling client chat requests. One issue we had was that each chat response would take 9 seconds. Nine seconds is way too long, and nobody wants to wait that long each time for the chatbot to respond.
So, we decided to implement OpenTelemetry tracing to see where the application was spending the most time doing it’s work.
Here is the screenshot of the first trace from the /role-play-chat endpoint:
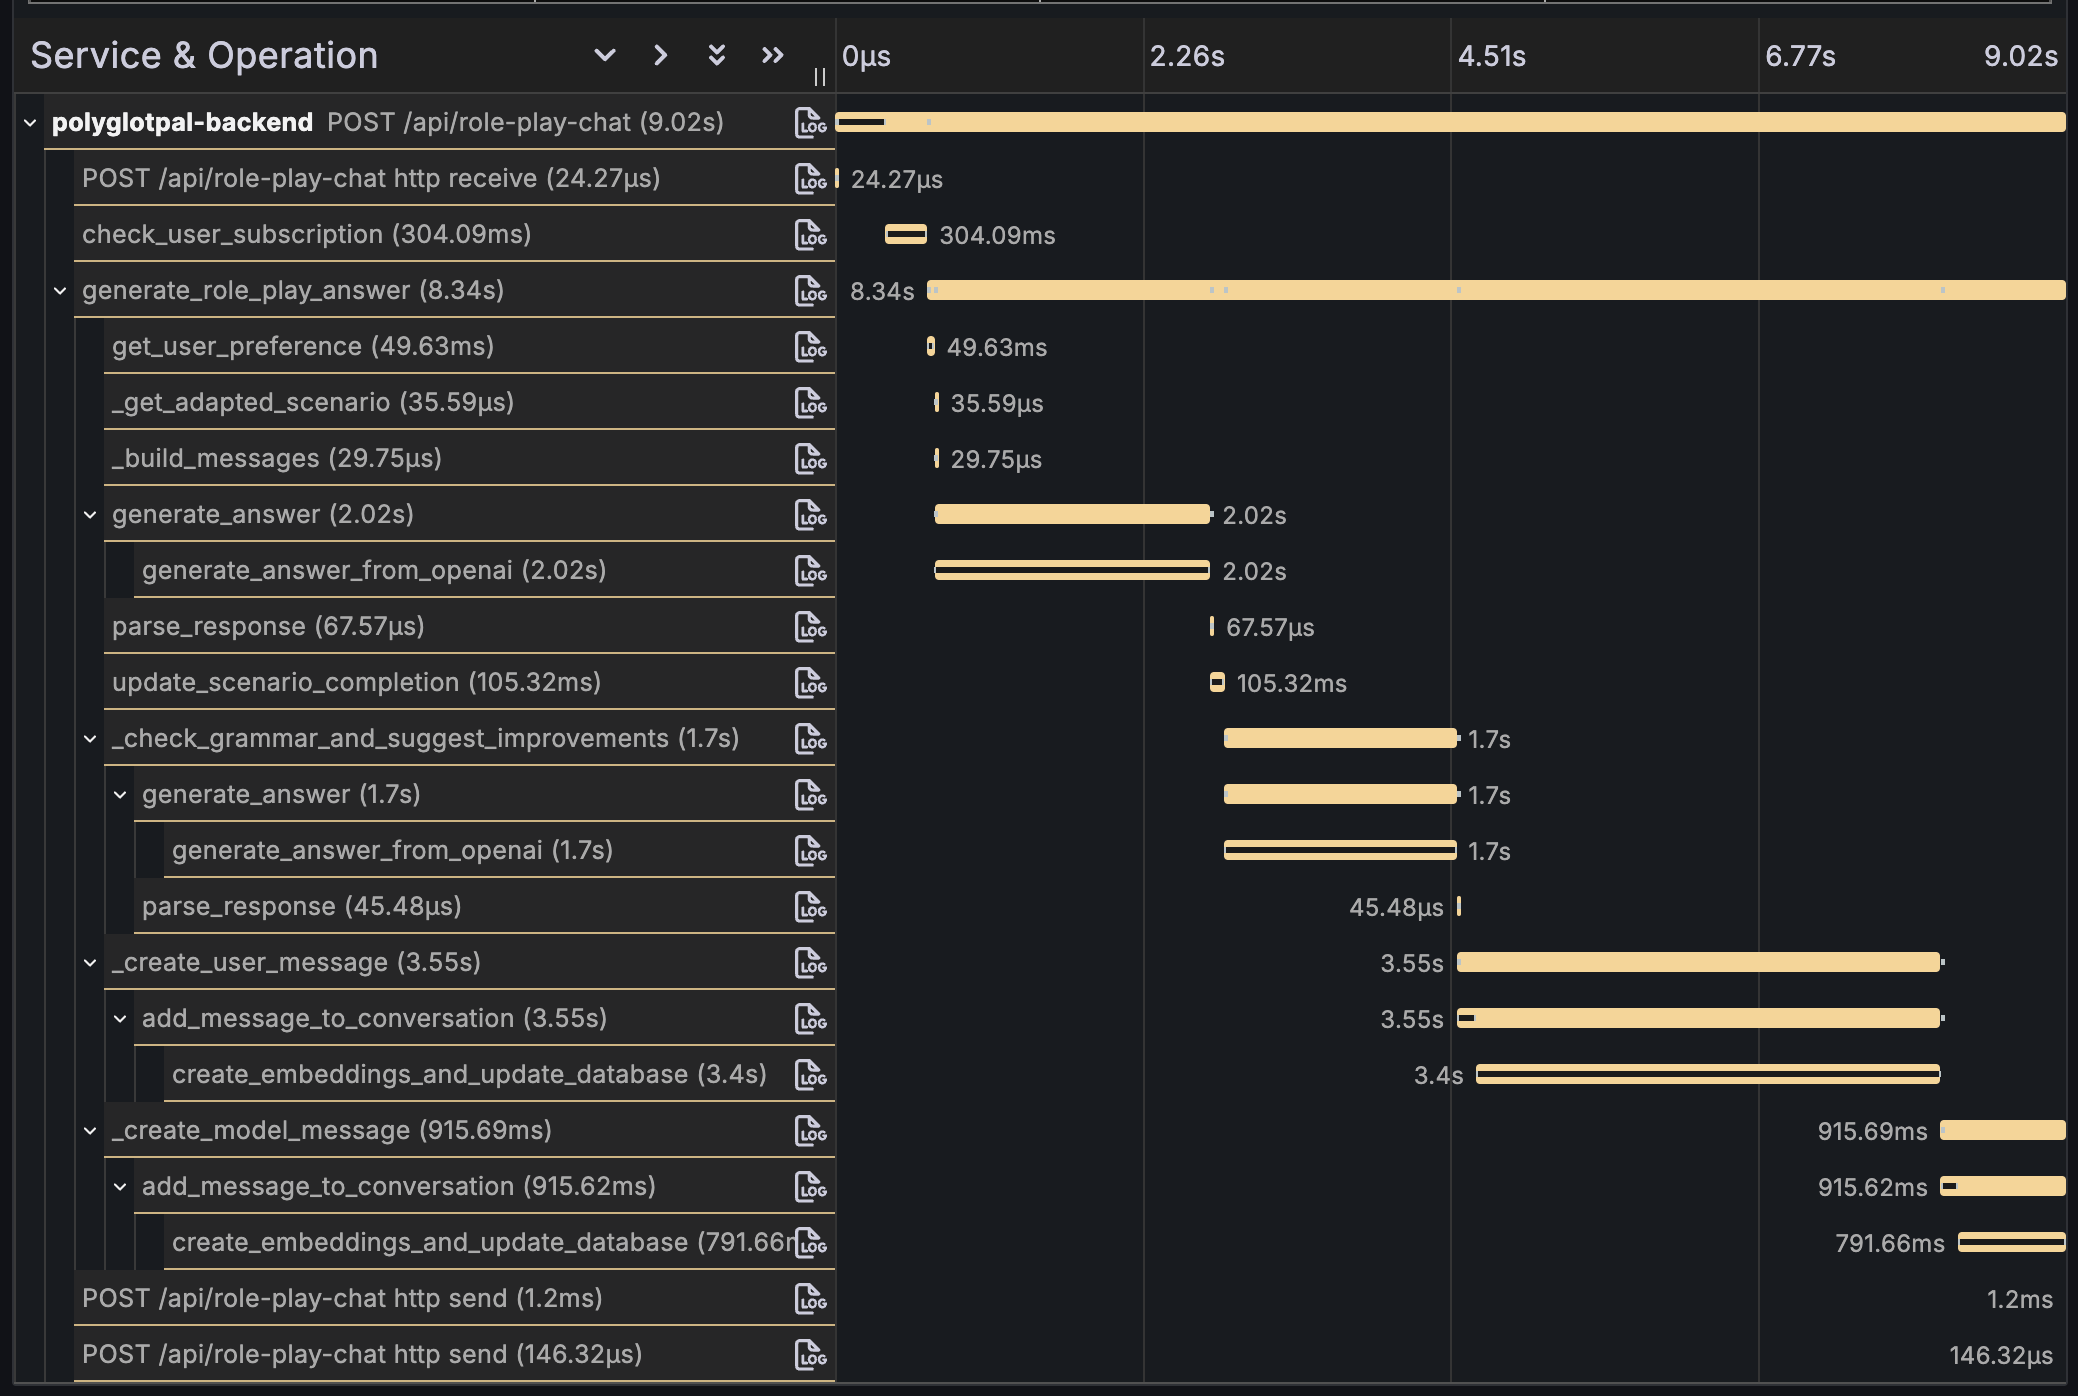
In the screenshot, you can see which functions are being called and how long it takes for them to be executed. We can also see that the application is doing a lot of waiting before returning the response to the client because some functions are waiting for other functions to finish their work, or there is a delay due to having to look up the data from the database.
After some tuning and refactoring in the codebase we achieved this result:
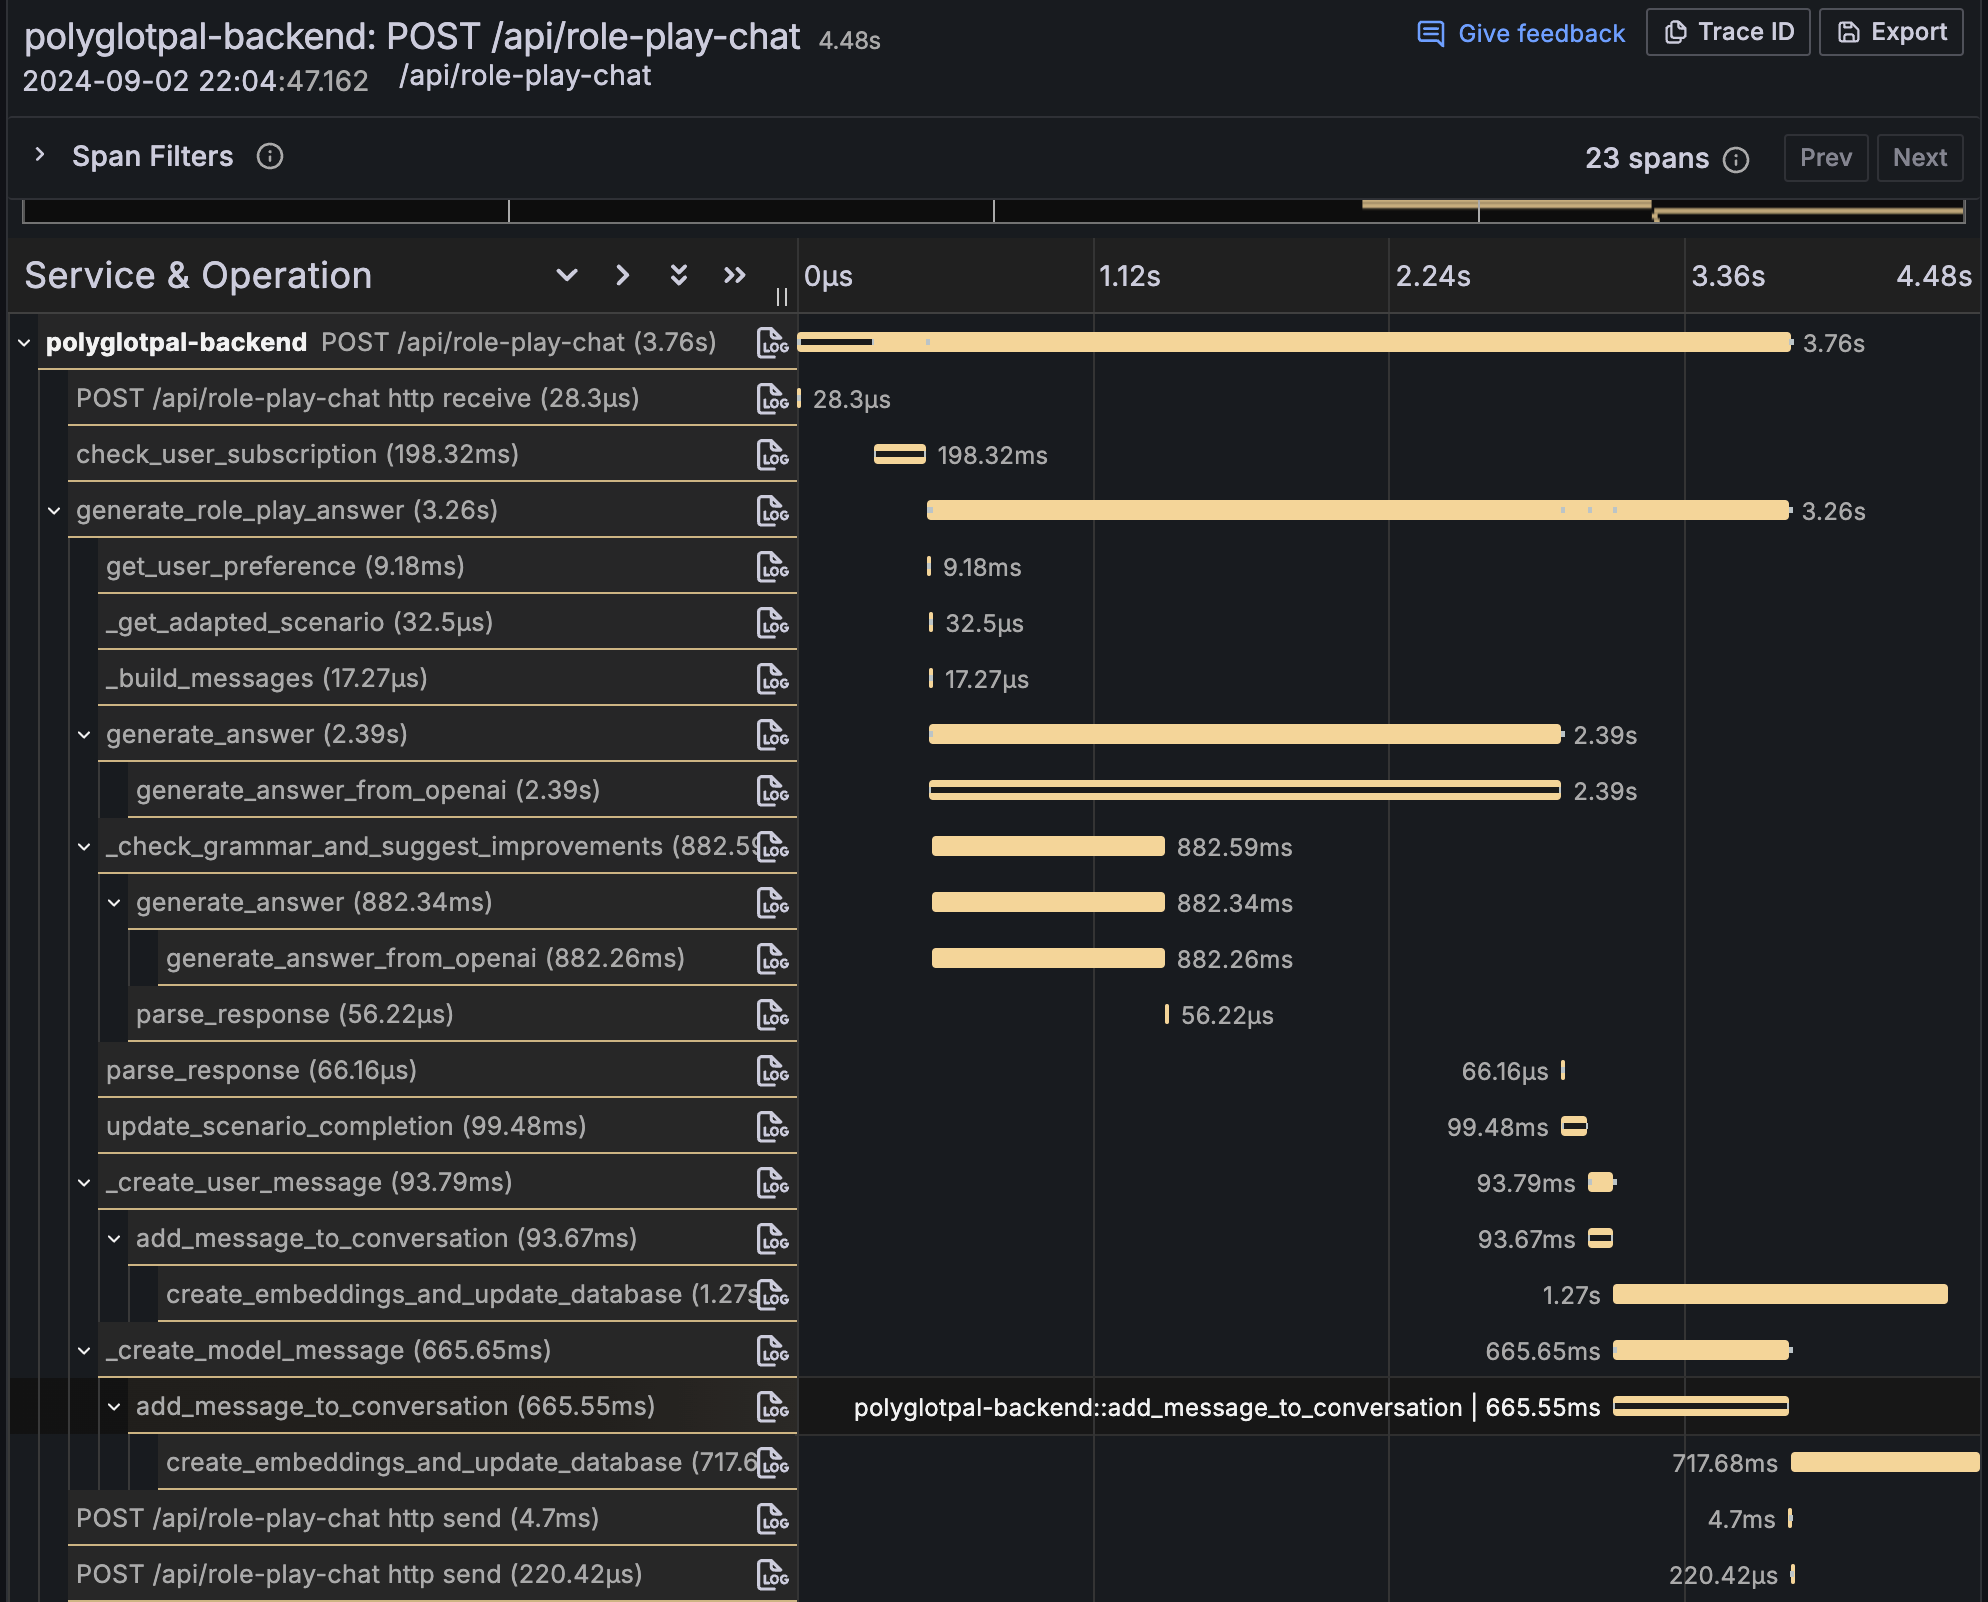
First thing to note is that we managed to get the /role-play-chat endpoint response down to 4.48 seconds, which is a pretty big speed boost.
Some of the main fixes that we did:
Refactored some of the functions work in parallel or in the background
Added Redis caching for objects that are fetched often from the database
Summary
Main takeaway here is that OpenTelemetry is a powerful tool in your arsenal that makes it easy to troubleshoot performance bottlenecks and other issues in a live system, regardless if you have monolith or micro-service architecture. So give it a try!
In case you want to work with us - click here